
- ⭐ Learn online (no require download), easy download (Google Drive)
- ⭐ Ensure to get all files in the file list
- ⭐ Get free update course through your email
- ⭐ Last Updated Date: 05-01-2024
- ⭐ Course Size: 4.1 GB GB
- ⭐ Duration: 3.5 hour(s)
Google Drive Proof
My Drive DataJosh Aharonoff - CFO Excel Dashboard , Reporting

My Drive DataJosh Aharonoff - CFO Excel Dashboard , Reporting01-Getting Started


My Drive DataJosh Aharonoff - CFO Excel Dashboard , Reporting02-Overview


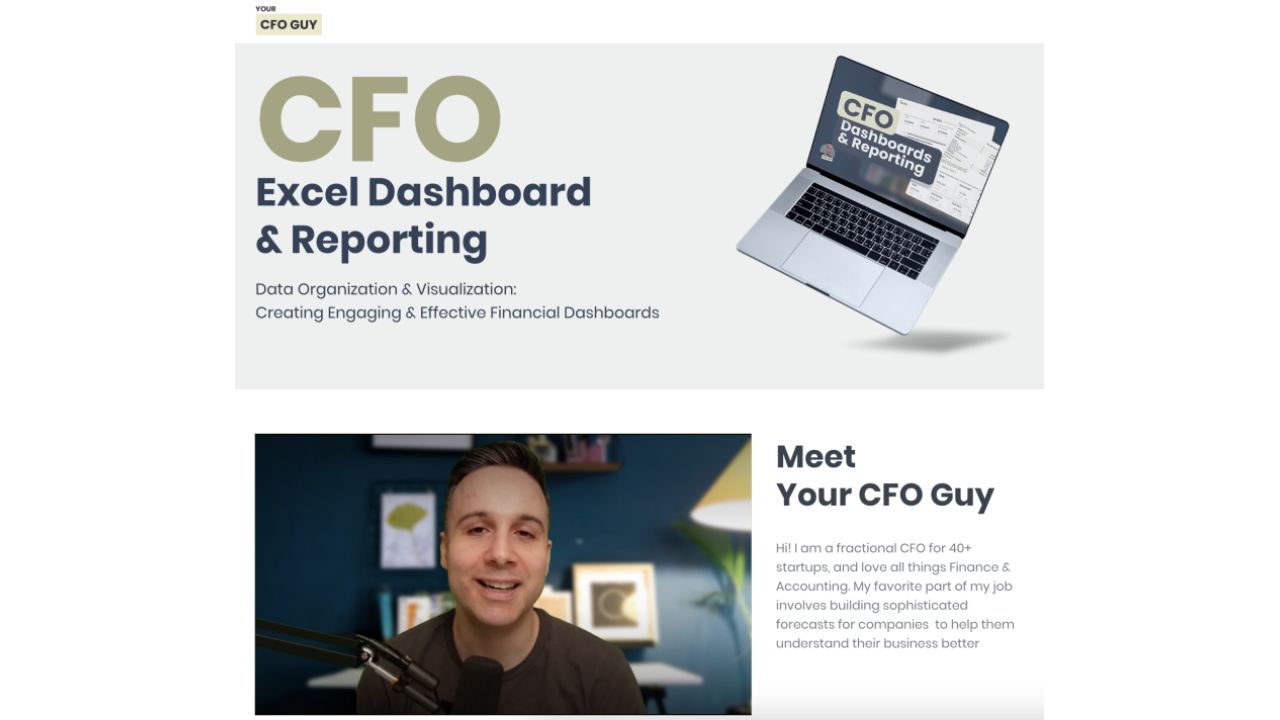
In a world of big data, the ability to represent data graphically is a crucial skill that sets you apart professionally. Introducing the insightful course by Josh Aharonoff – CFO Excel Dashboard & Reporting, a program designed to equip financial leaders with the skills to consolidate huge amounts of data into readable, meaningful visual reports. This course is meticulously structured into six modules starting from the basics to the most complex aspects of creating financial dashboards and reports using Excel.
The first module, ‘Getting Started’, lays the perfect foundation for familiarizing participants with the technical aspects of Excel and how it can be deployed for efficient reporting. This is followed by the ‘Overview’ module that systematically introduces the various components of Excel and their significance in creating financial reports.
‘Designing Summarized Financials Report’, the third module, puts you through the paces, teaching you how to transform raw data into concise financial statements. Here you will dig deep into the Balance Sheet, Profit & Loss, Cash Flows and period-over-period changes, setting the tune for the all-important module of ‘Creating Dashboards.’
The dashboard creation module encapsulates the key facets of creating dynamic KPI dashboards using Pivottables and Pivot charts, along with a hands-on guide to designing tables for Budget vs Actuals, creating Gauge charts, and finalizing the design. A highlight of this module is Aharonoff’s unique approach to creating dashboards using dynamic spill array linked to a chart.
By the time you wrap up this stage, you would have all the tools you need to create an impressive management report and a cash out dashboard. A bonus awaiting you in the ‘Wrapping Up’ section is a guide on designing captivating cover pages in Excel. But the learning doesn’t stop with the completion of this course. An additional ‘Bonus’ module ensures your education continues, unravelling additional tips and tricks for your Excel journey.
Priced competitively at $49, Josh Aharonoff – CFO Excel Dashboard & Reporting is a smart and seamless way to upscale skills, improve analytics, and take data-driven decisions with confidence, in a world driven by numbers. Whether you are a finance professional, a management student, an entrepreneur or simply an individual looking to take control of your company’s or personal finance data, this course is your stepping stone to a whole new world of financial data management.
To invest in Josh Aharonoff – CFO Excel Dashboard & Reporting is to invest in a data-driven future. Empower yourself with the ability to create compelling dashboards and reports, and let your charts do the talking. Seize this opportunity and embrace the journey of becoming a financial whiz at Excel today!
Share Now!
Related Products


Popular & Trending


Newest Products